Project 06
Reckoner
It refuses to answer when it cannot prove the answer.
Every analytics tool you have ever used will answer you. This one checks first whether your question deserved an answer.
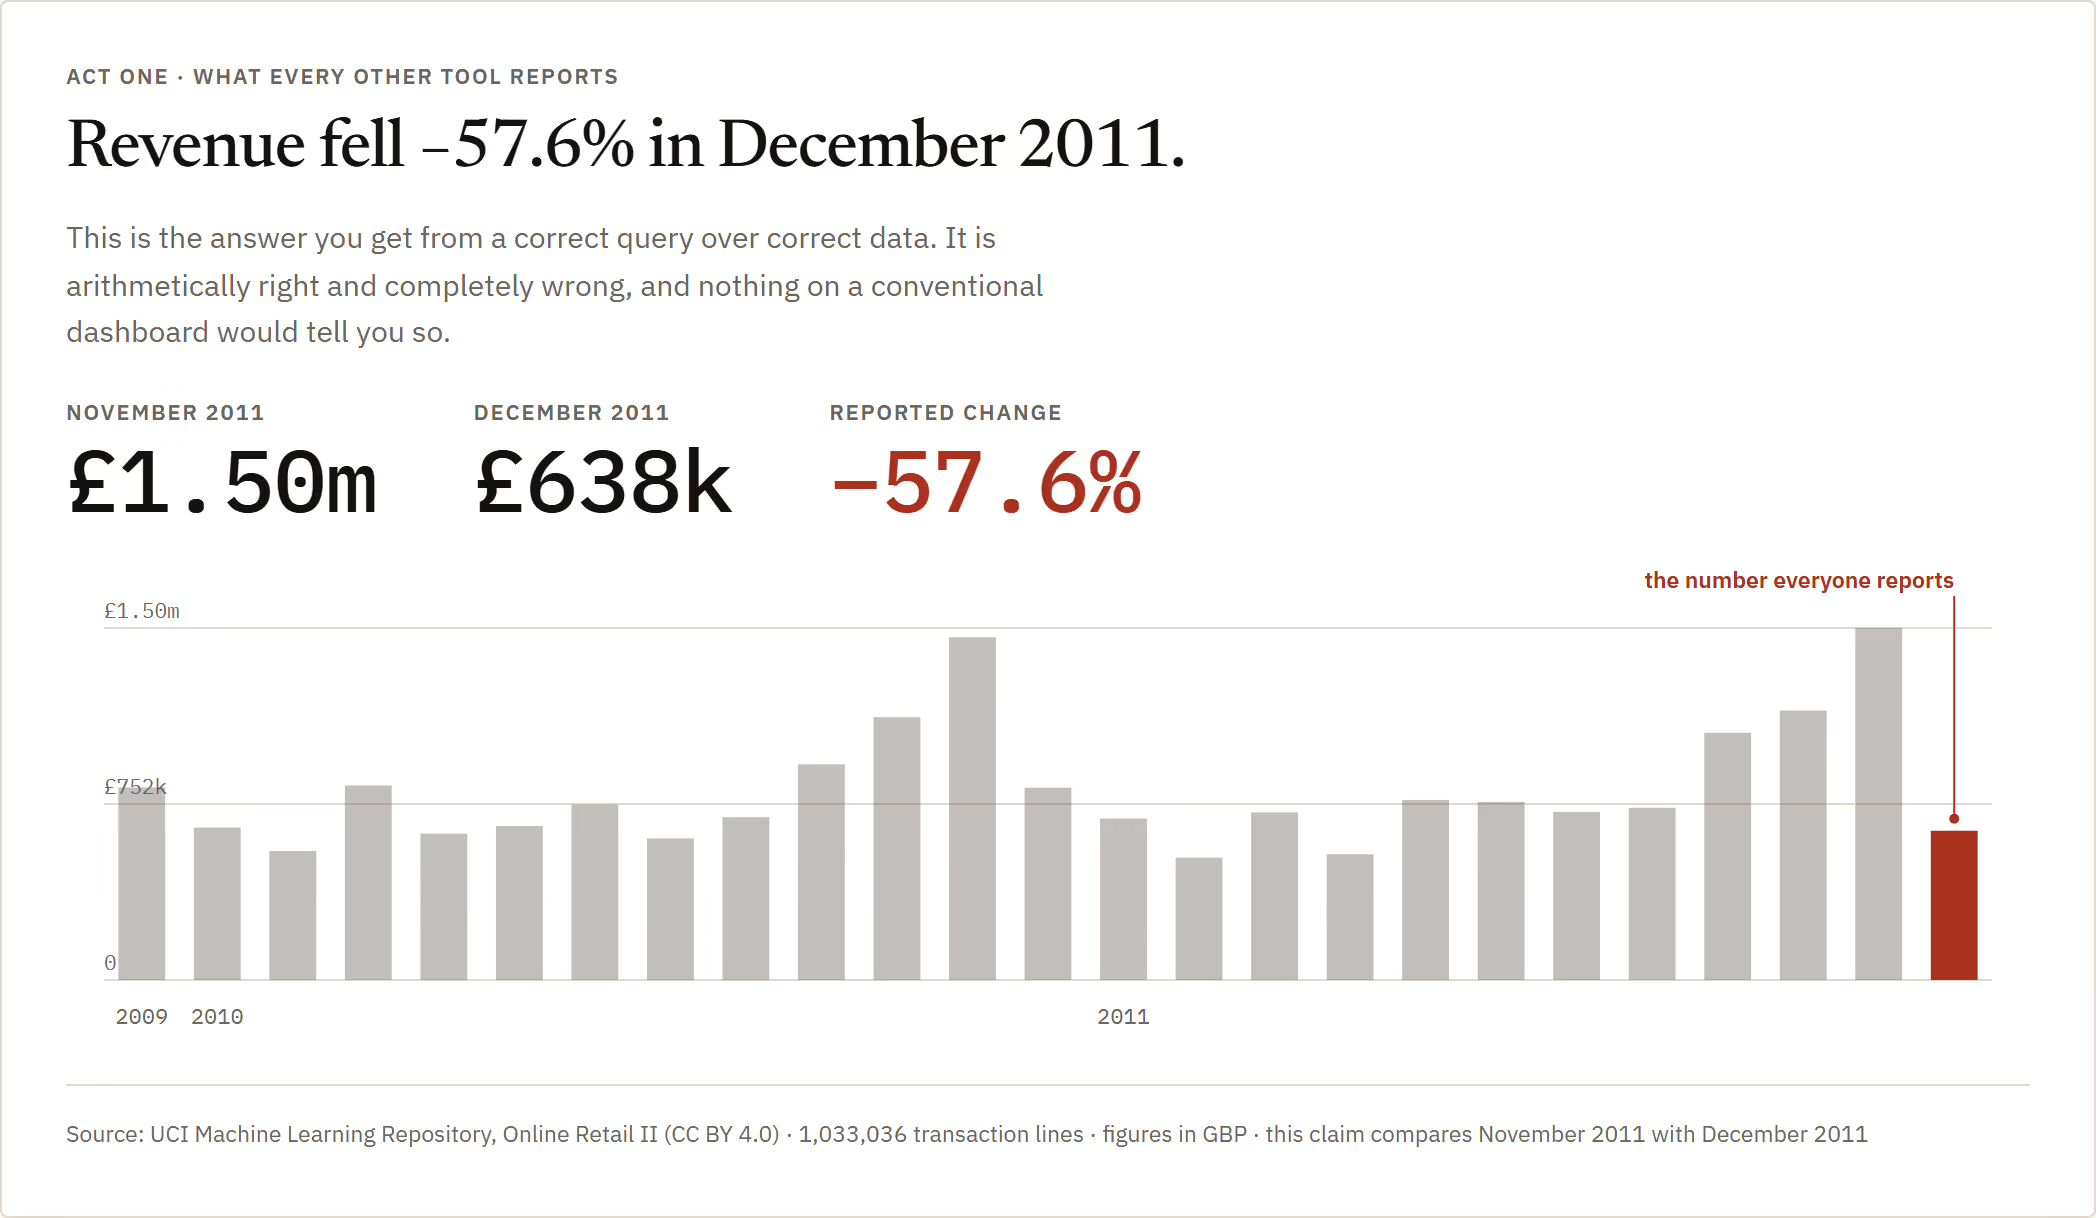
Every analytics tool you have ever used will answer you. That is the problem with all of them.
I pointed one at a real retailer's ledger — a million transaction lines — and asked the most ordinary question in business: what happened to revenue last month. It said revenue fell 57.6%. That number is arithmetically perfect. It is also completely wrong, and no dashboard on earth would have told me so.
It is wrong because "last month" in that file is nine days long. The data stops on the ninth. Comparing nine days against a full month measures the calendar, not the company. Somewhere right now a real person is walking into a real board meeting with exactly that number, because the query was correct and the data was correct and nothing in between was paid to be sceptical.
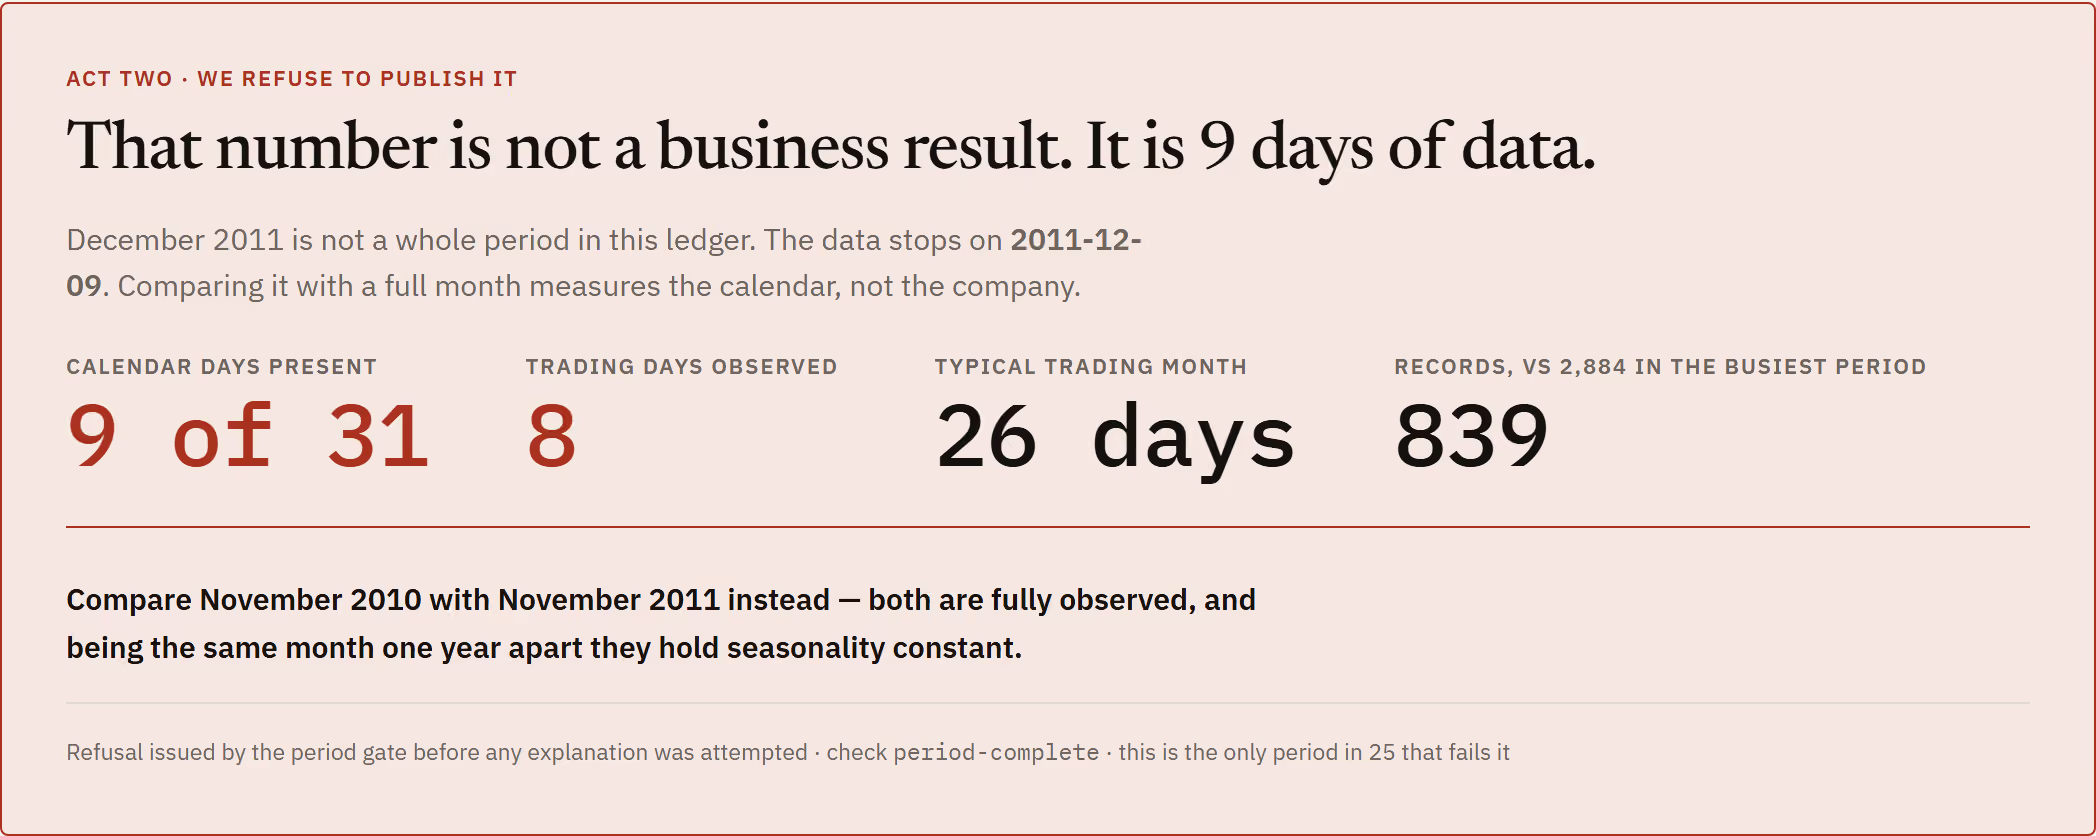
So I built the thing that is paid to be sceptical. Reckoner computes that same −57.6% — and then refuses to publish it. It checks whether the two periods are even comparable before it attempts any explanation, and when they are not it says so, shows you the day counts, and proposes the comparison you should have asked for instead: November against November, one year apart, both complete, seasonality held constant. One period out of twenty-five fails that gate — and it is the one everybody would have reported.
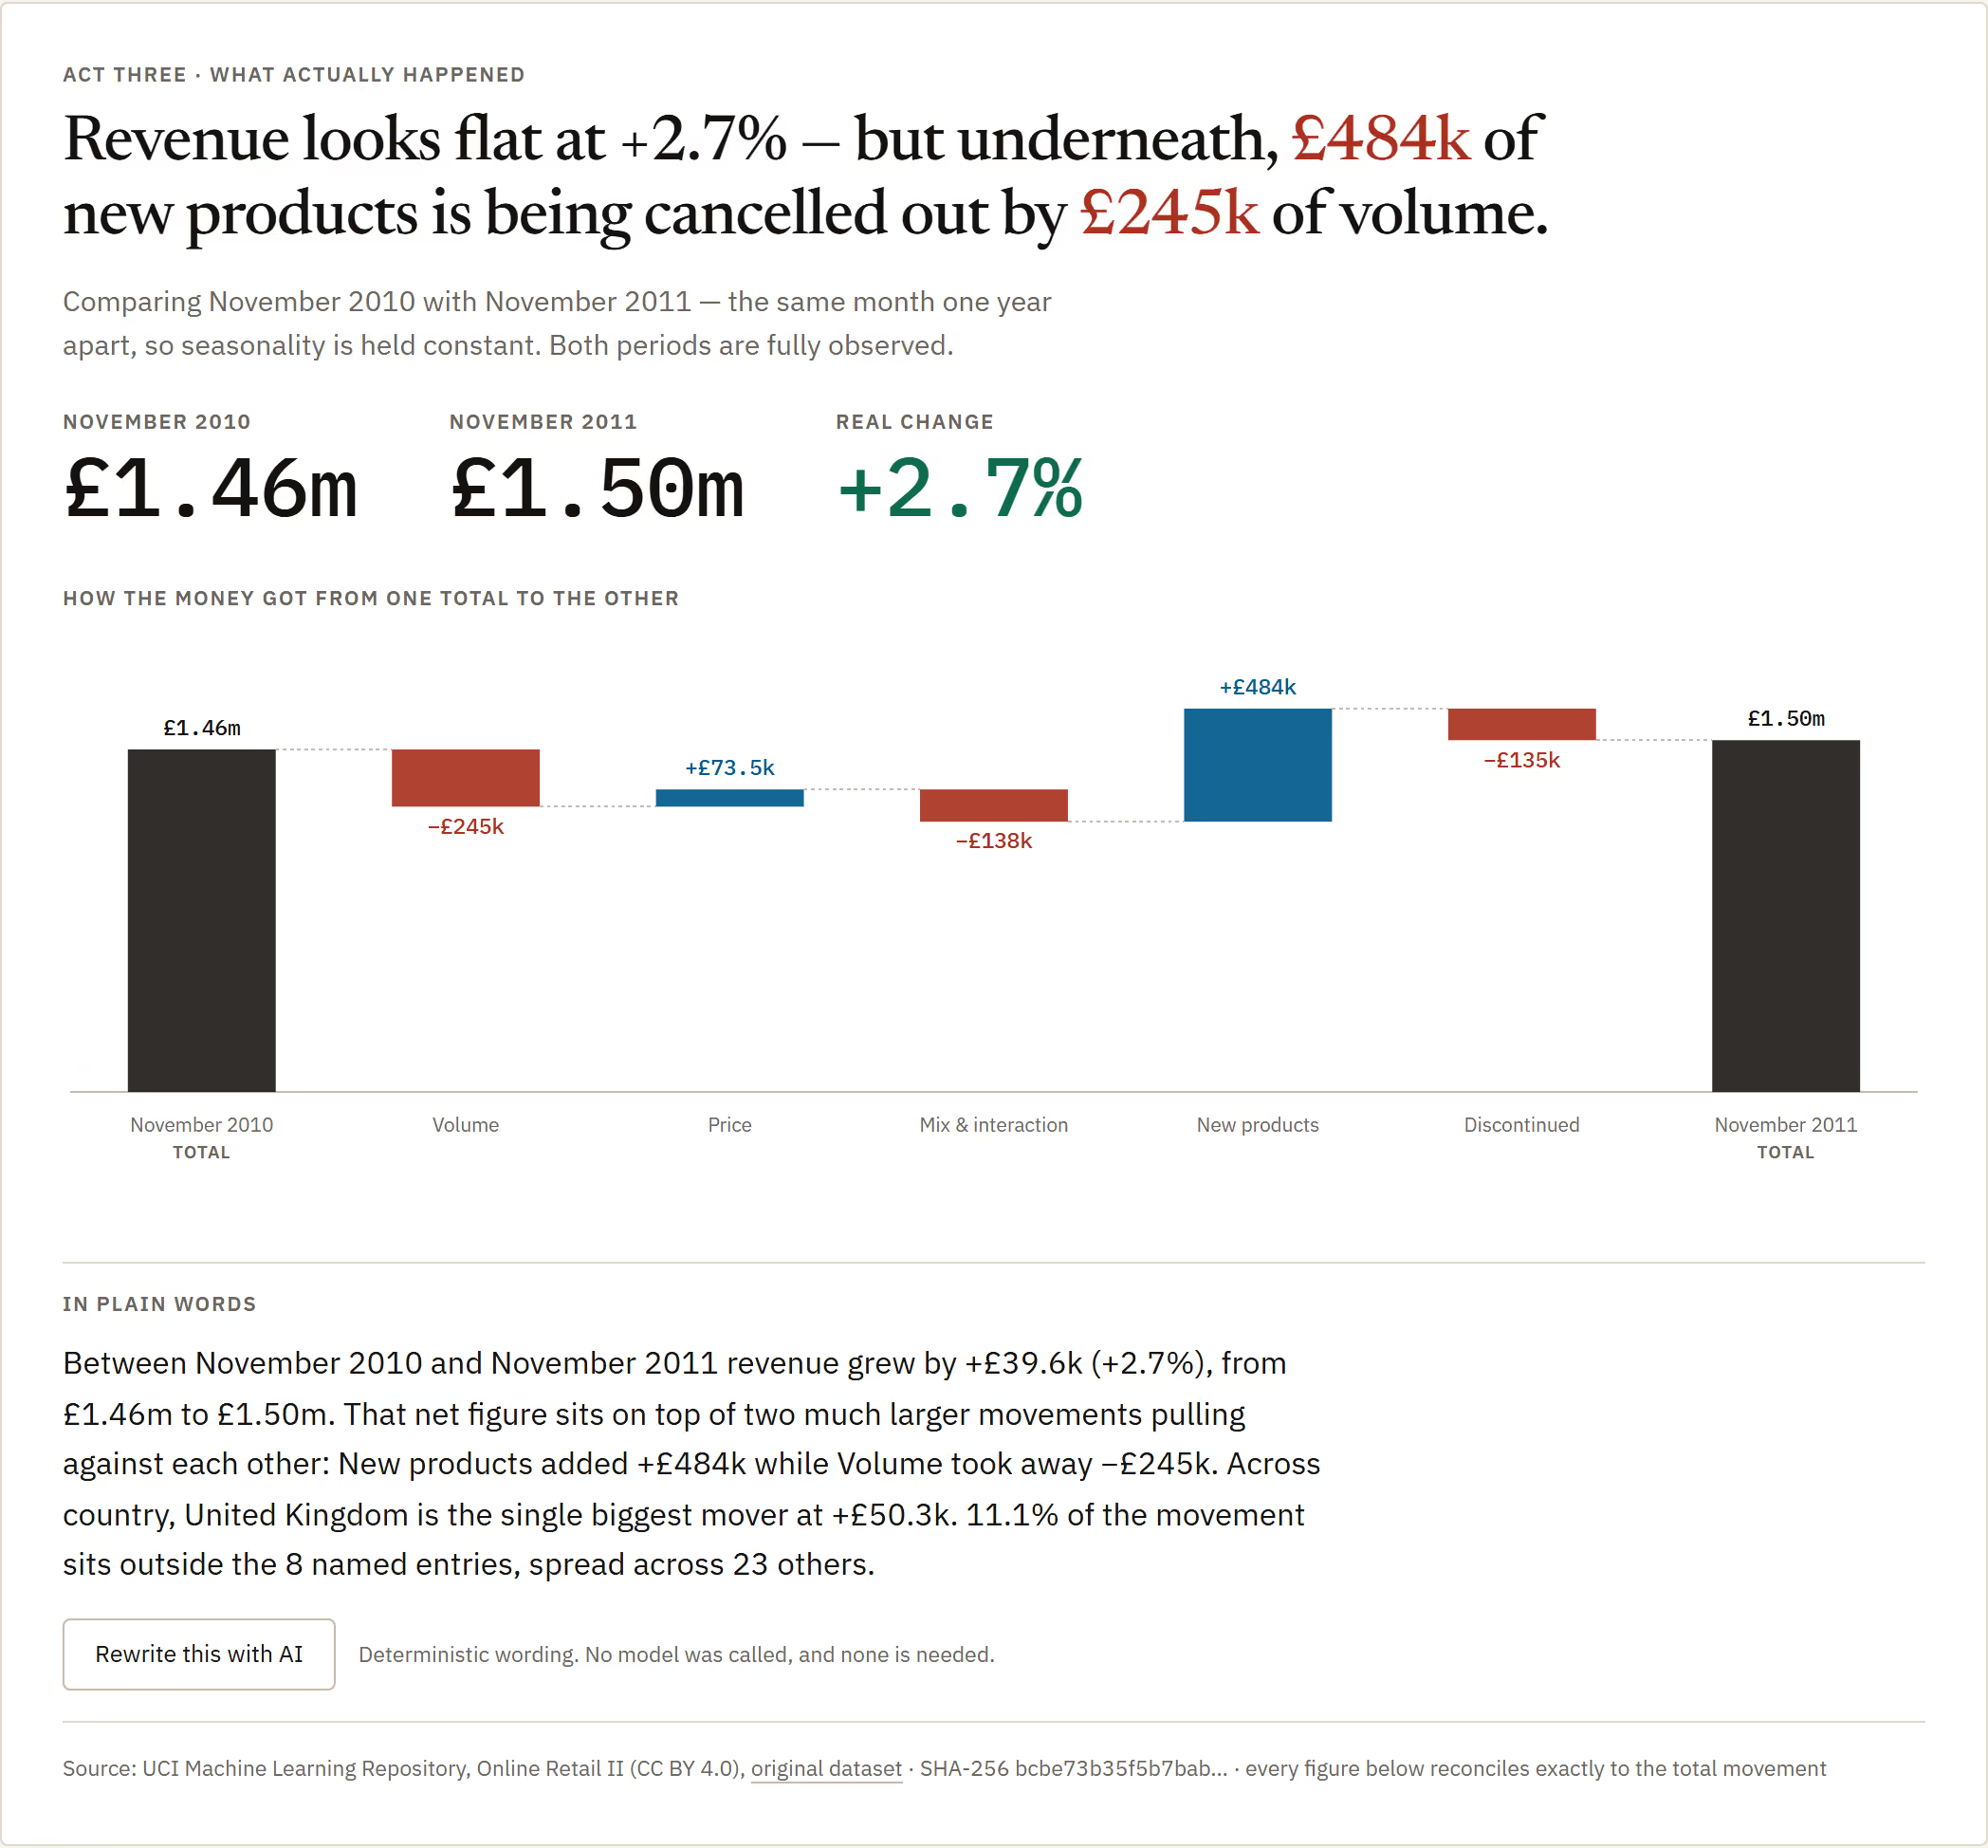
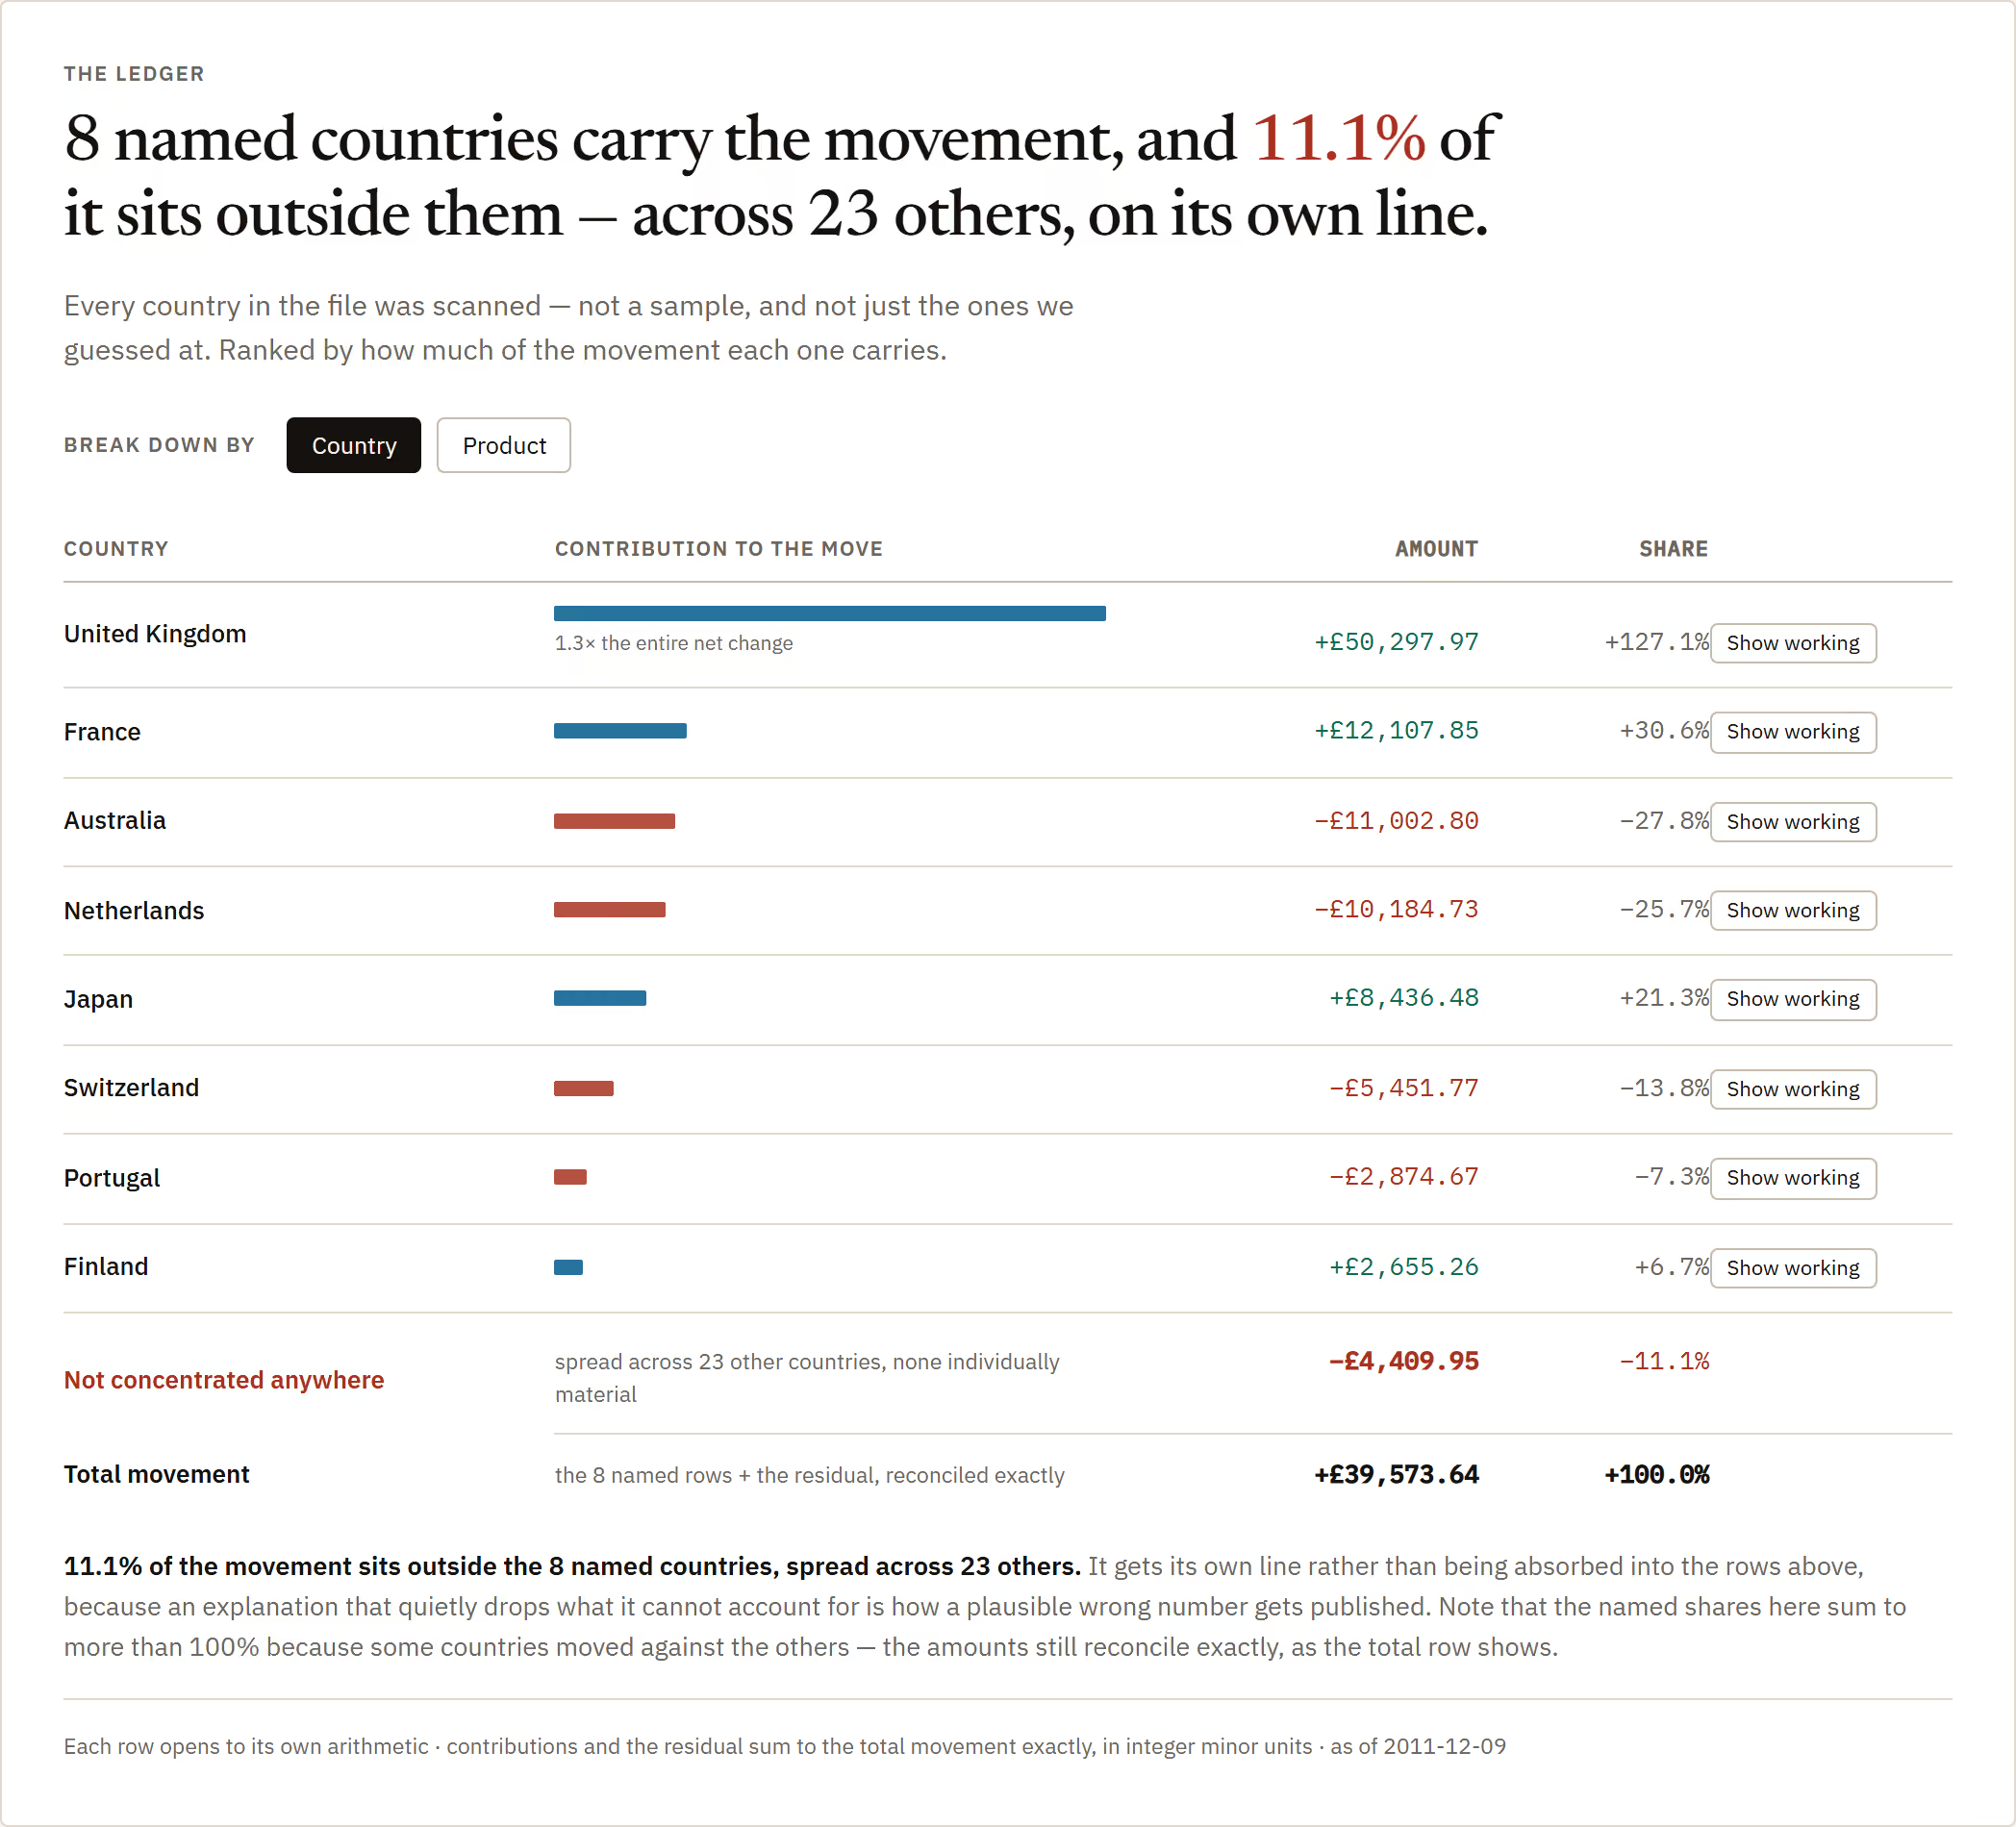
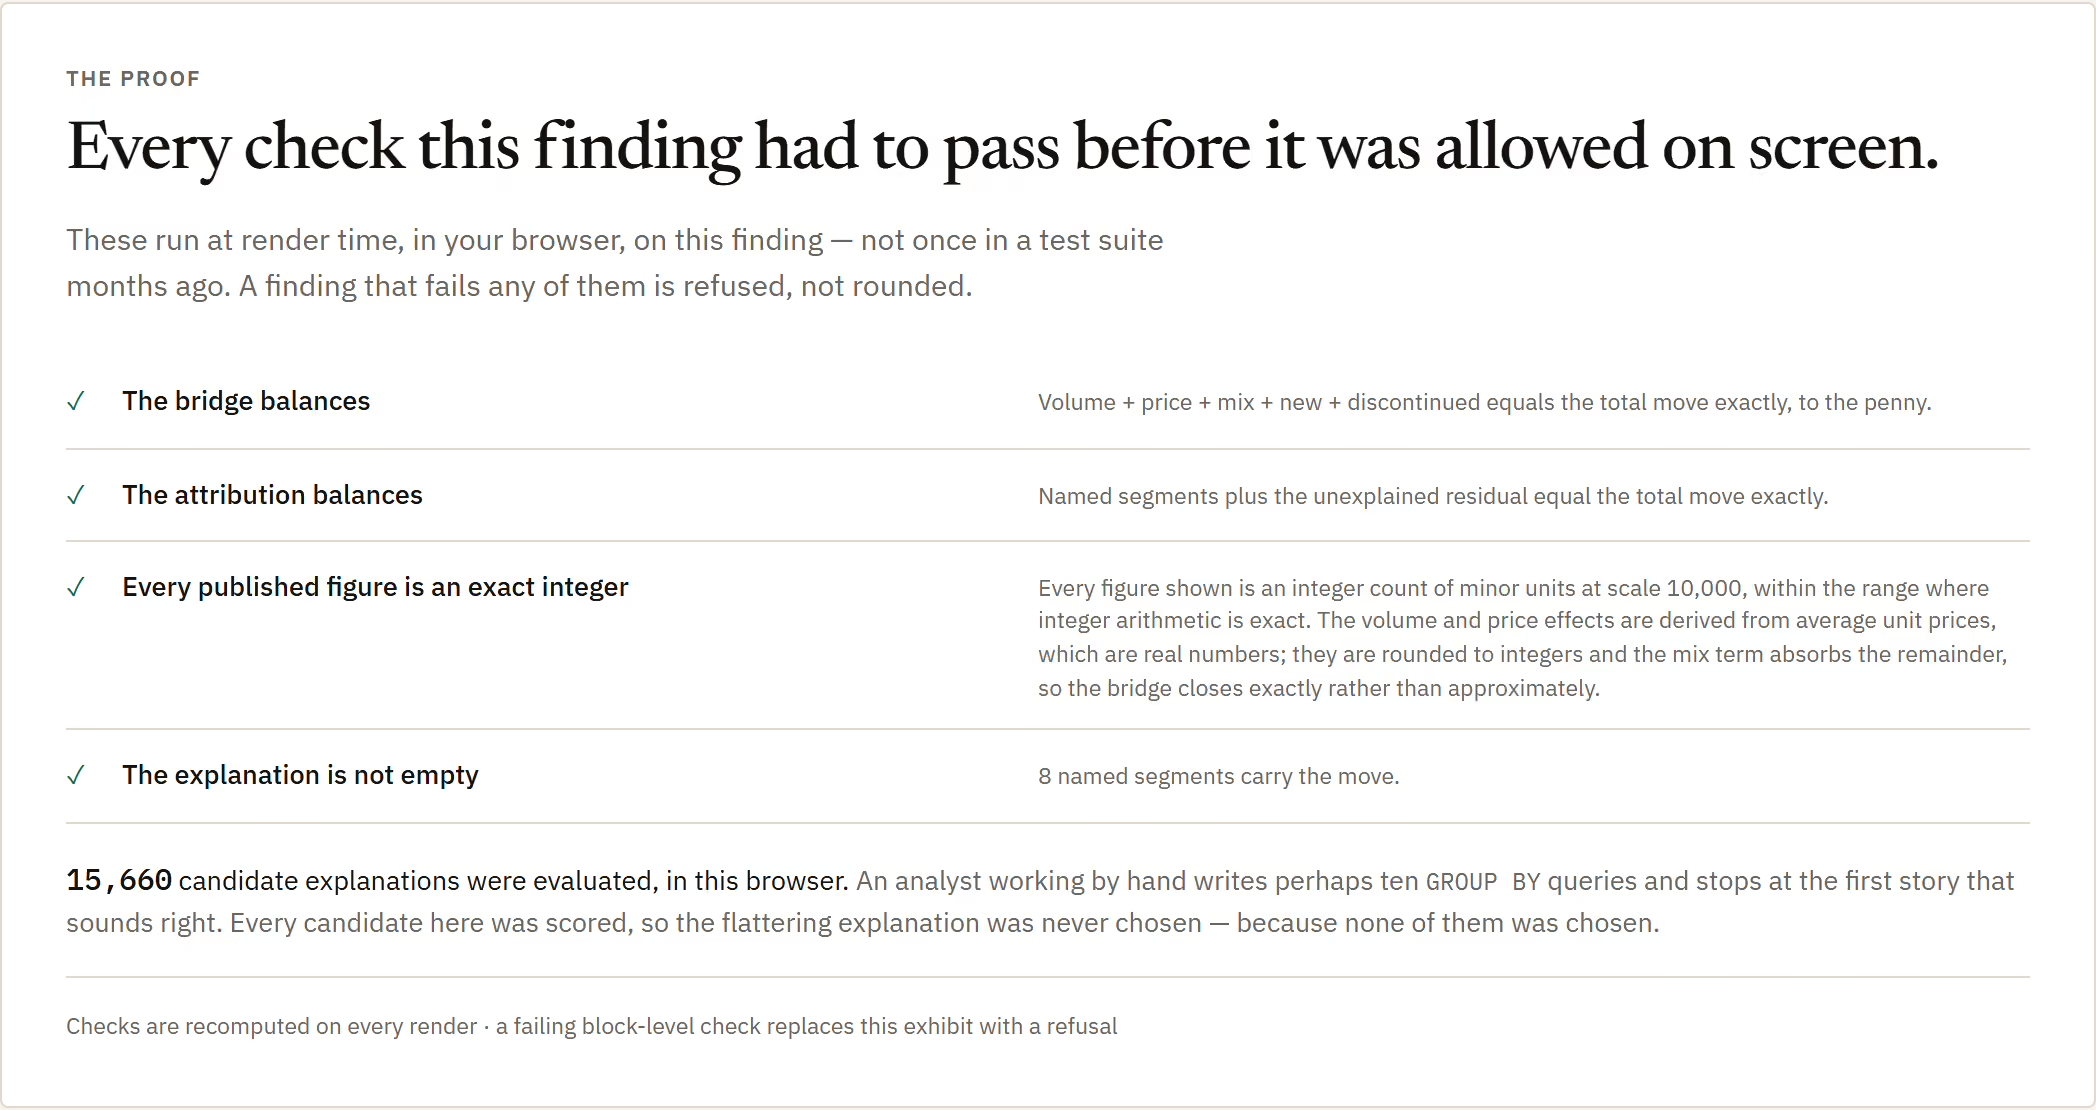
The honest answer turns out to be plus 2.7%. Which is also not the finding, because "roughly flat" is a disguise. Underneath it, four hundred and eighty-four thousand pounds of brand-new products is being eaten alive by two hundred and forty-five thousand of lost volume, a hundred and thirty-eight of mix and a hundred and thirty-five of lines that were discontinued. So it breaks the movement into named pieces — volume, price, mix, new products, discontinued — and the pieces add back up to the totals exactly. That is the sentence a CEO actually needs: not "we are flat", but "we are flat because a new range is carrying a shrinking old one".
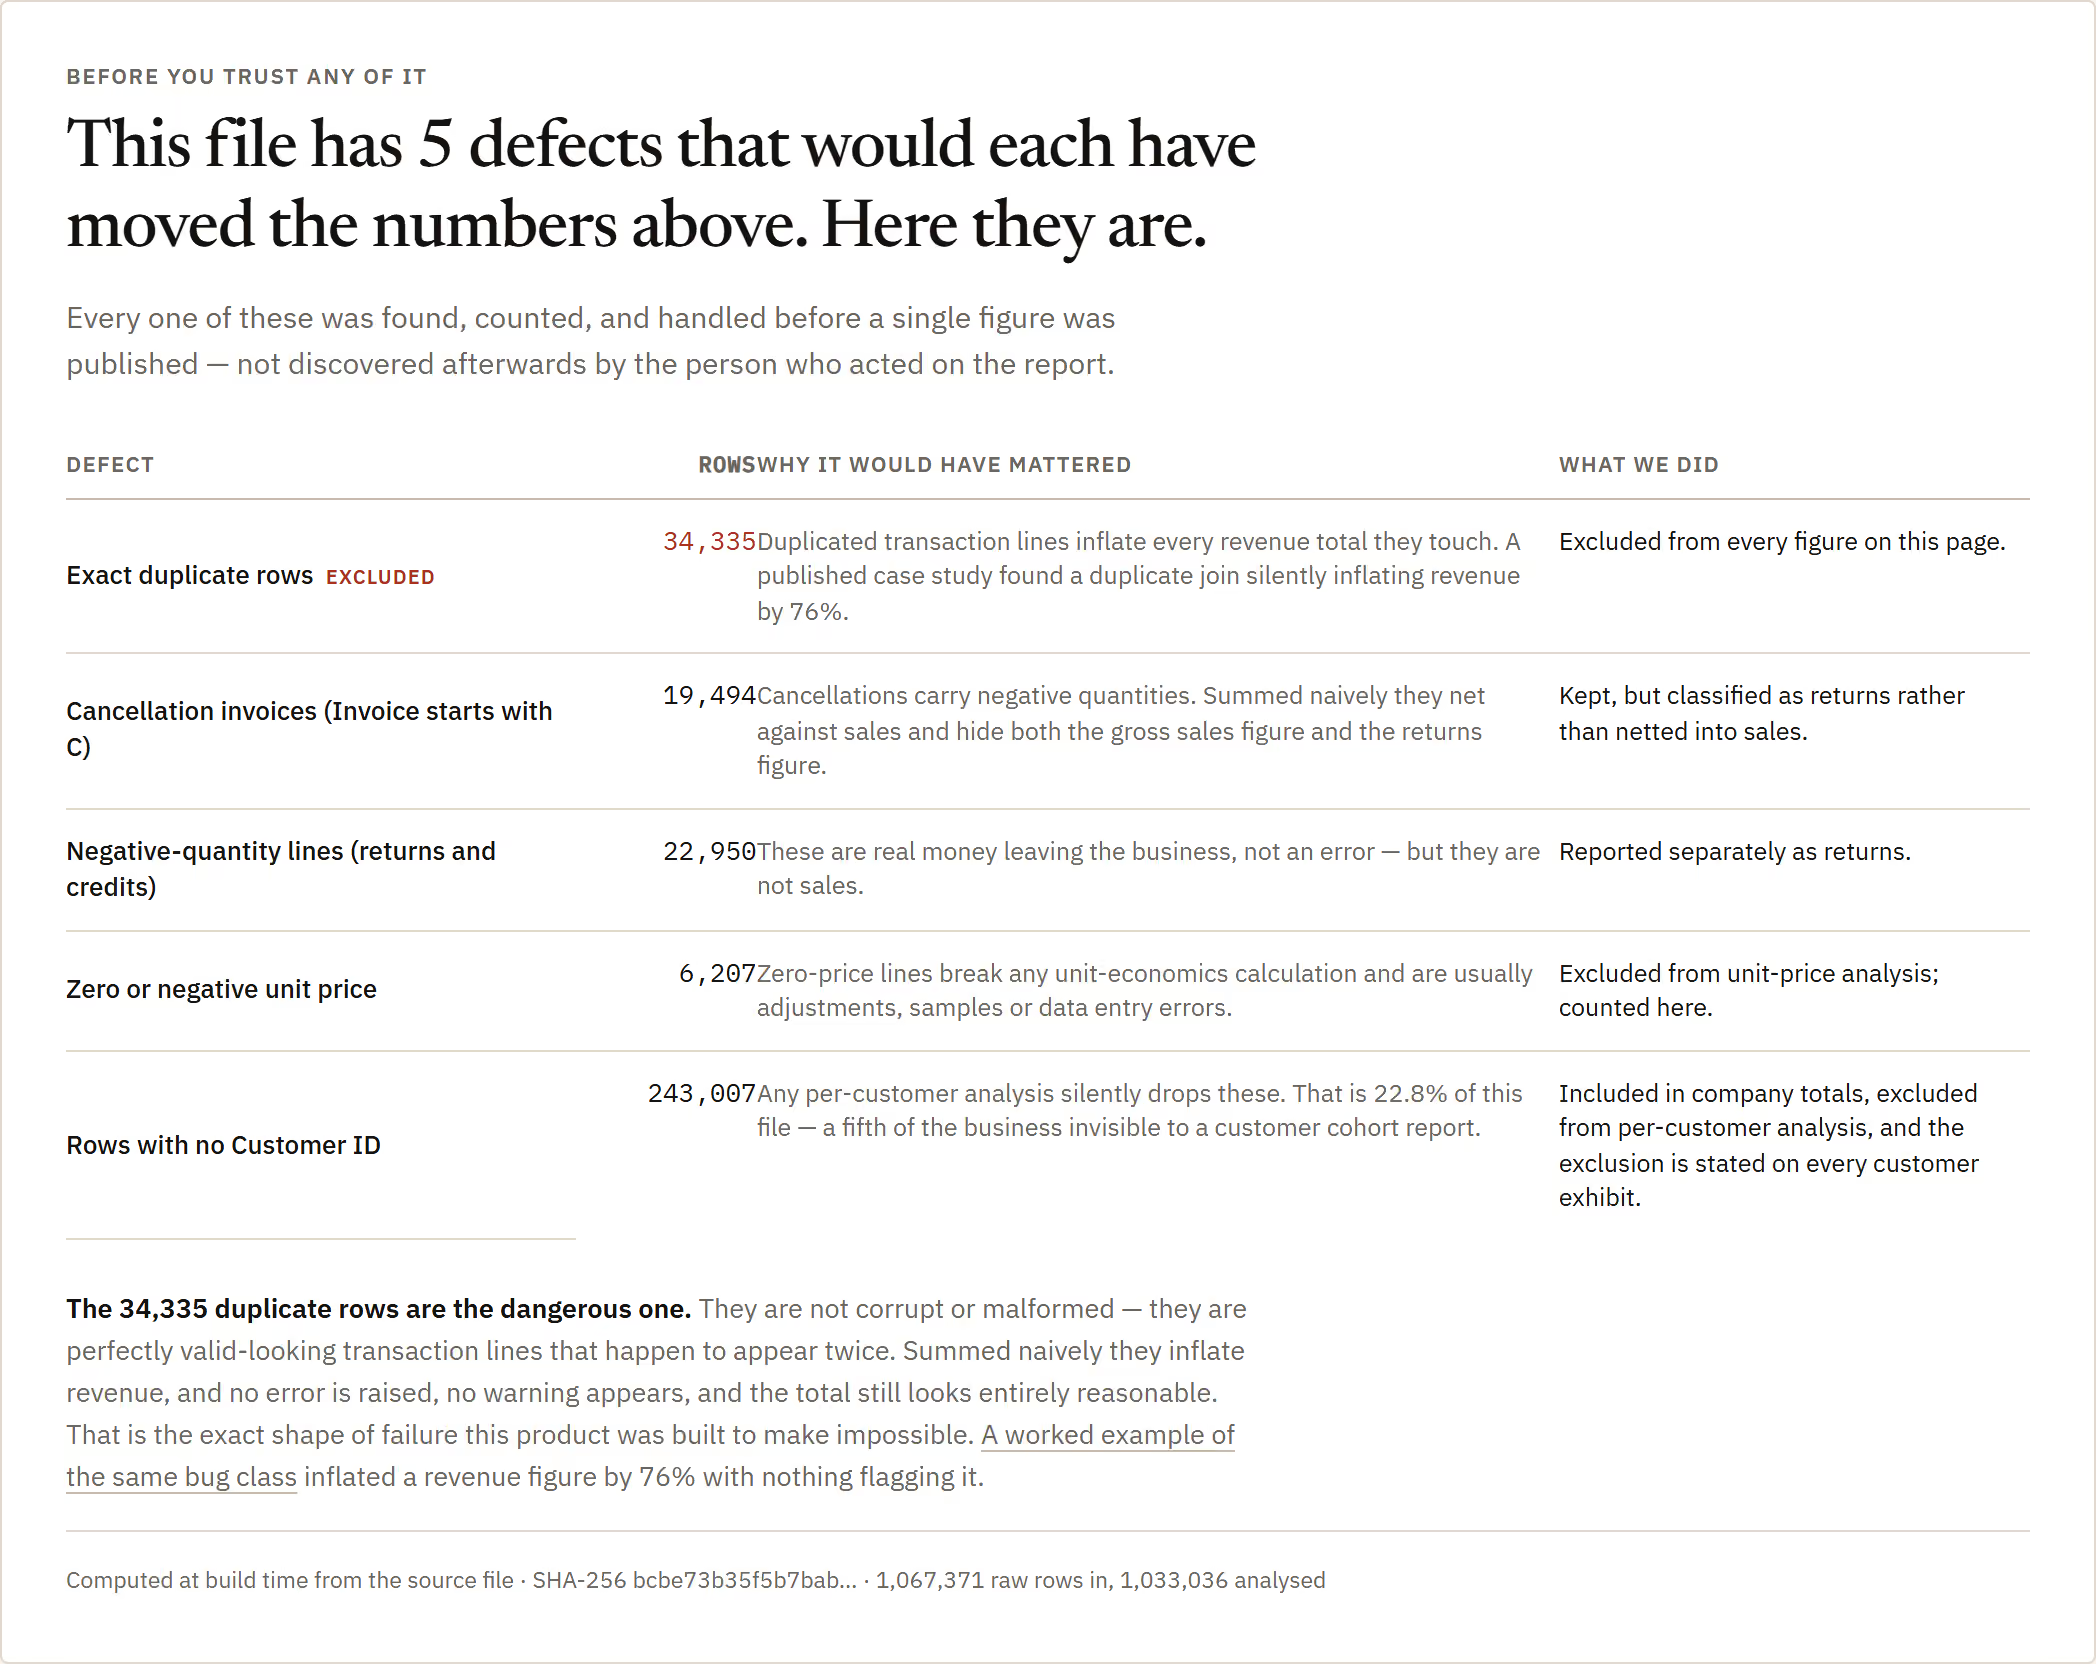
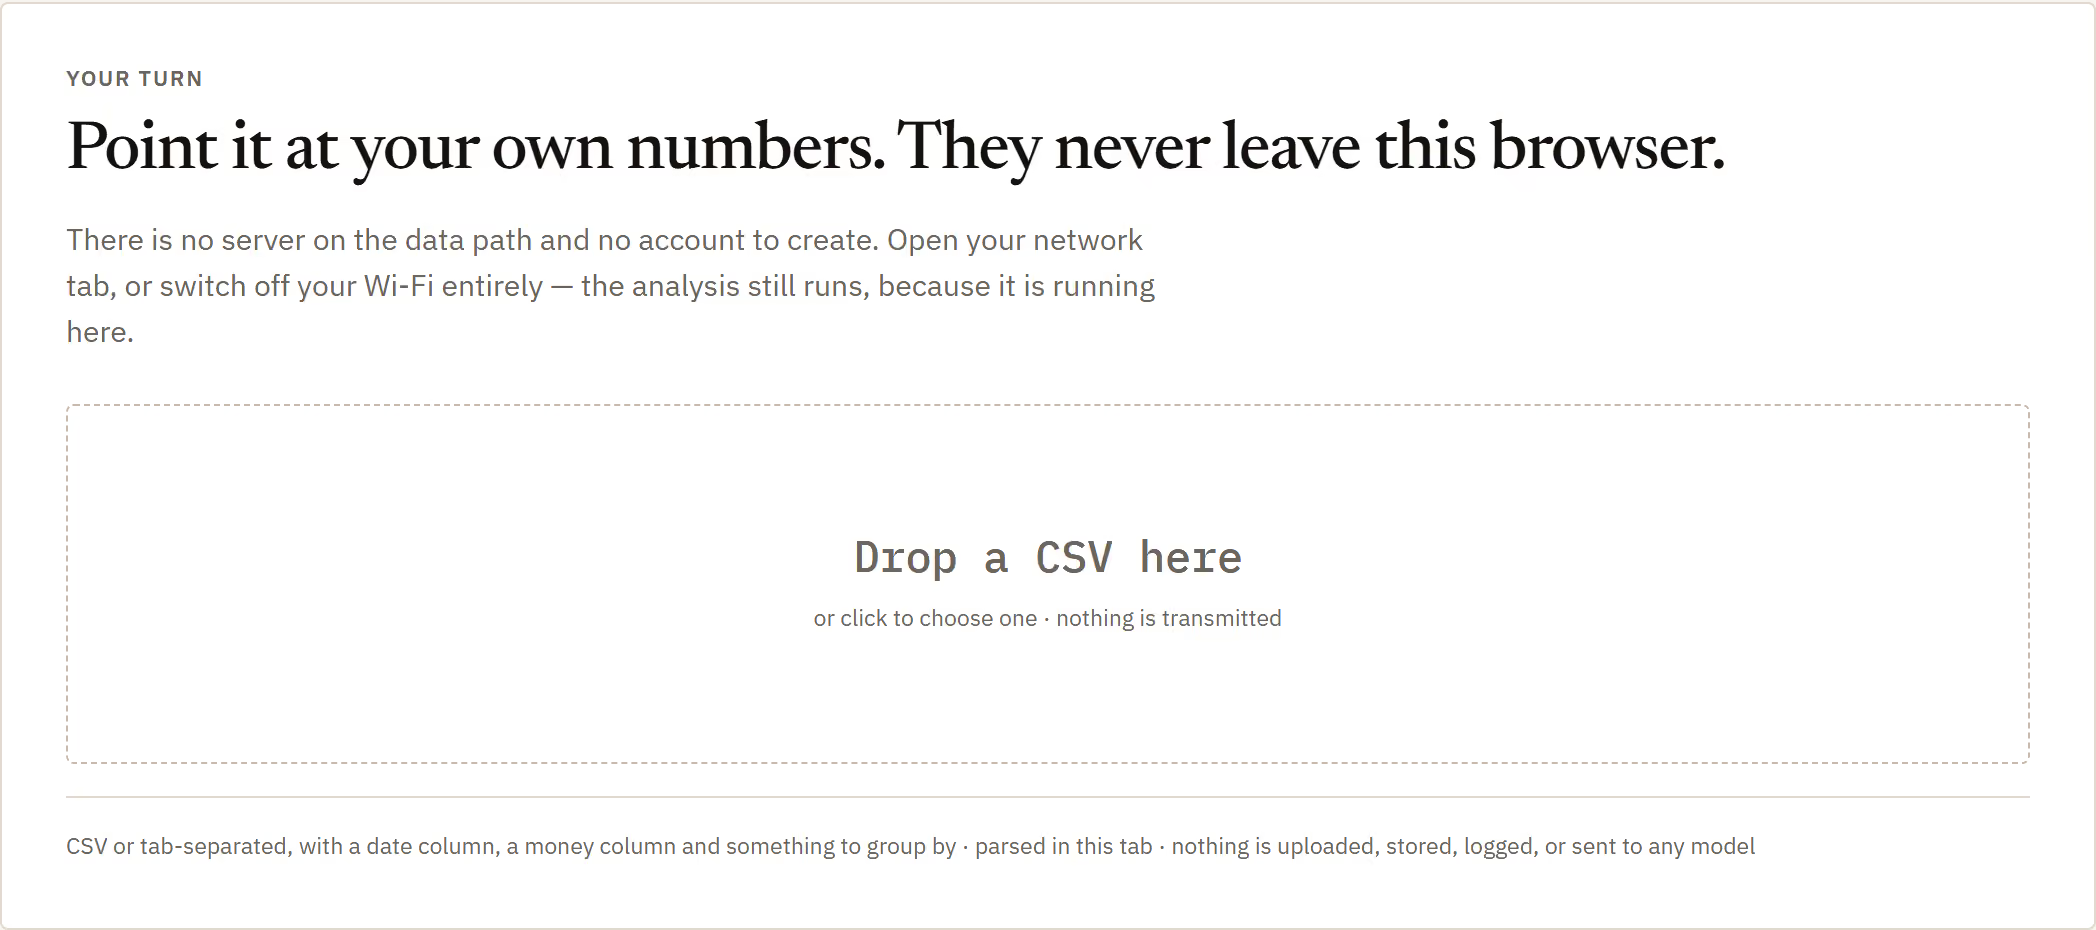
Two things I insisted on. The data-quality check runs first, before any finding, not as a footnote underneath one — because if your file is wrong this will faithfully explain a wrong number, and you need to know that before you read the answer. And a million rows never leave your laptop; the whole thing runs in the browser, no server, no upload, no account. If you want to point a tool at a real ledger without emailing it to a vendor, that is the entire ballgame.
Why it was hard
Every analytics tool ever built will answer you. That is the problem. Run a correct query over correct data and you get "revenue fell 57.6% last month" — arithmetically perfect and completely wrong, because last month is only nine days long in the file. No dashboard on earth would tell you that. The hard part is not computing the number; it is building something that computes the number, sees why it is meaningless, and declines to show it to your CEO.
How it actually works
Before it explains anything at all, it asks whether your question was even fair. One period in twenty-five fails — and it is the one everybody would have put in the board pack.
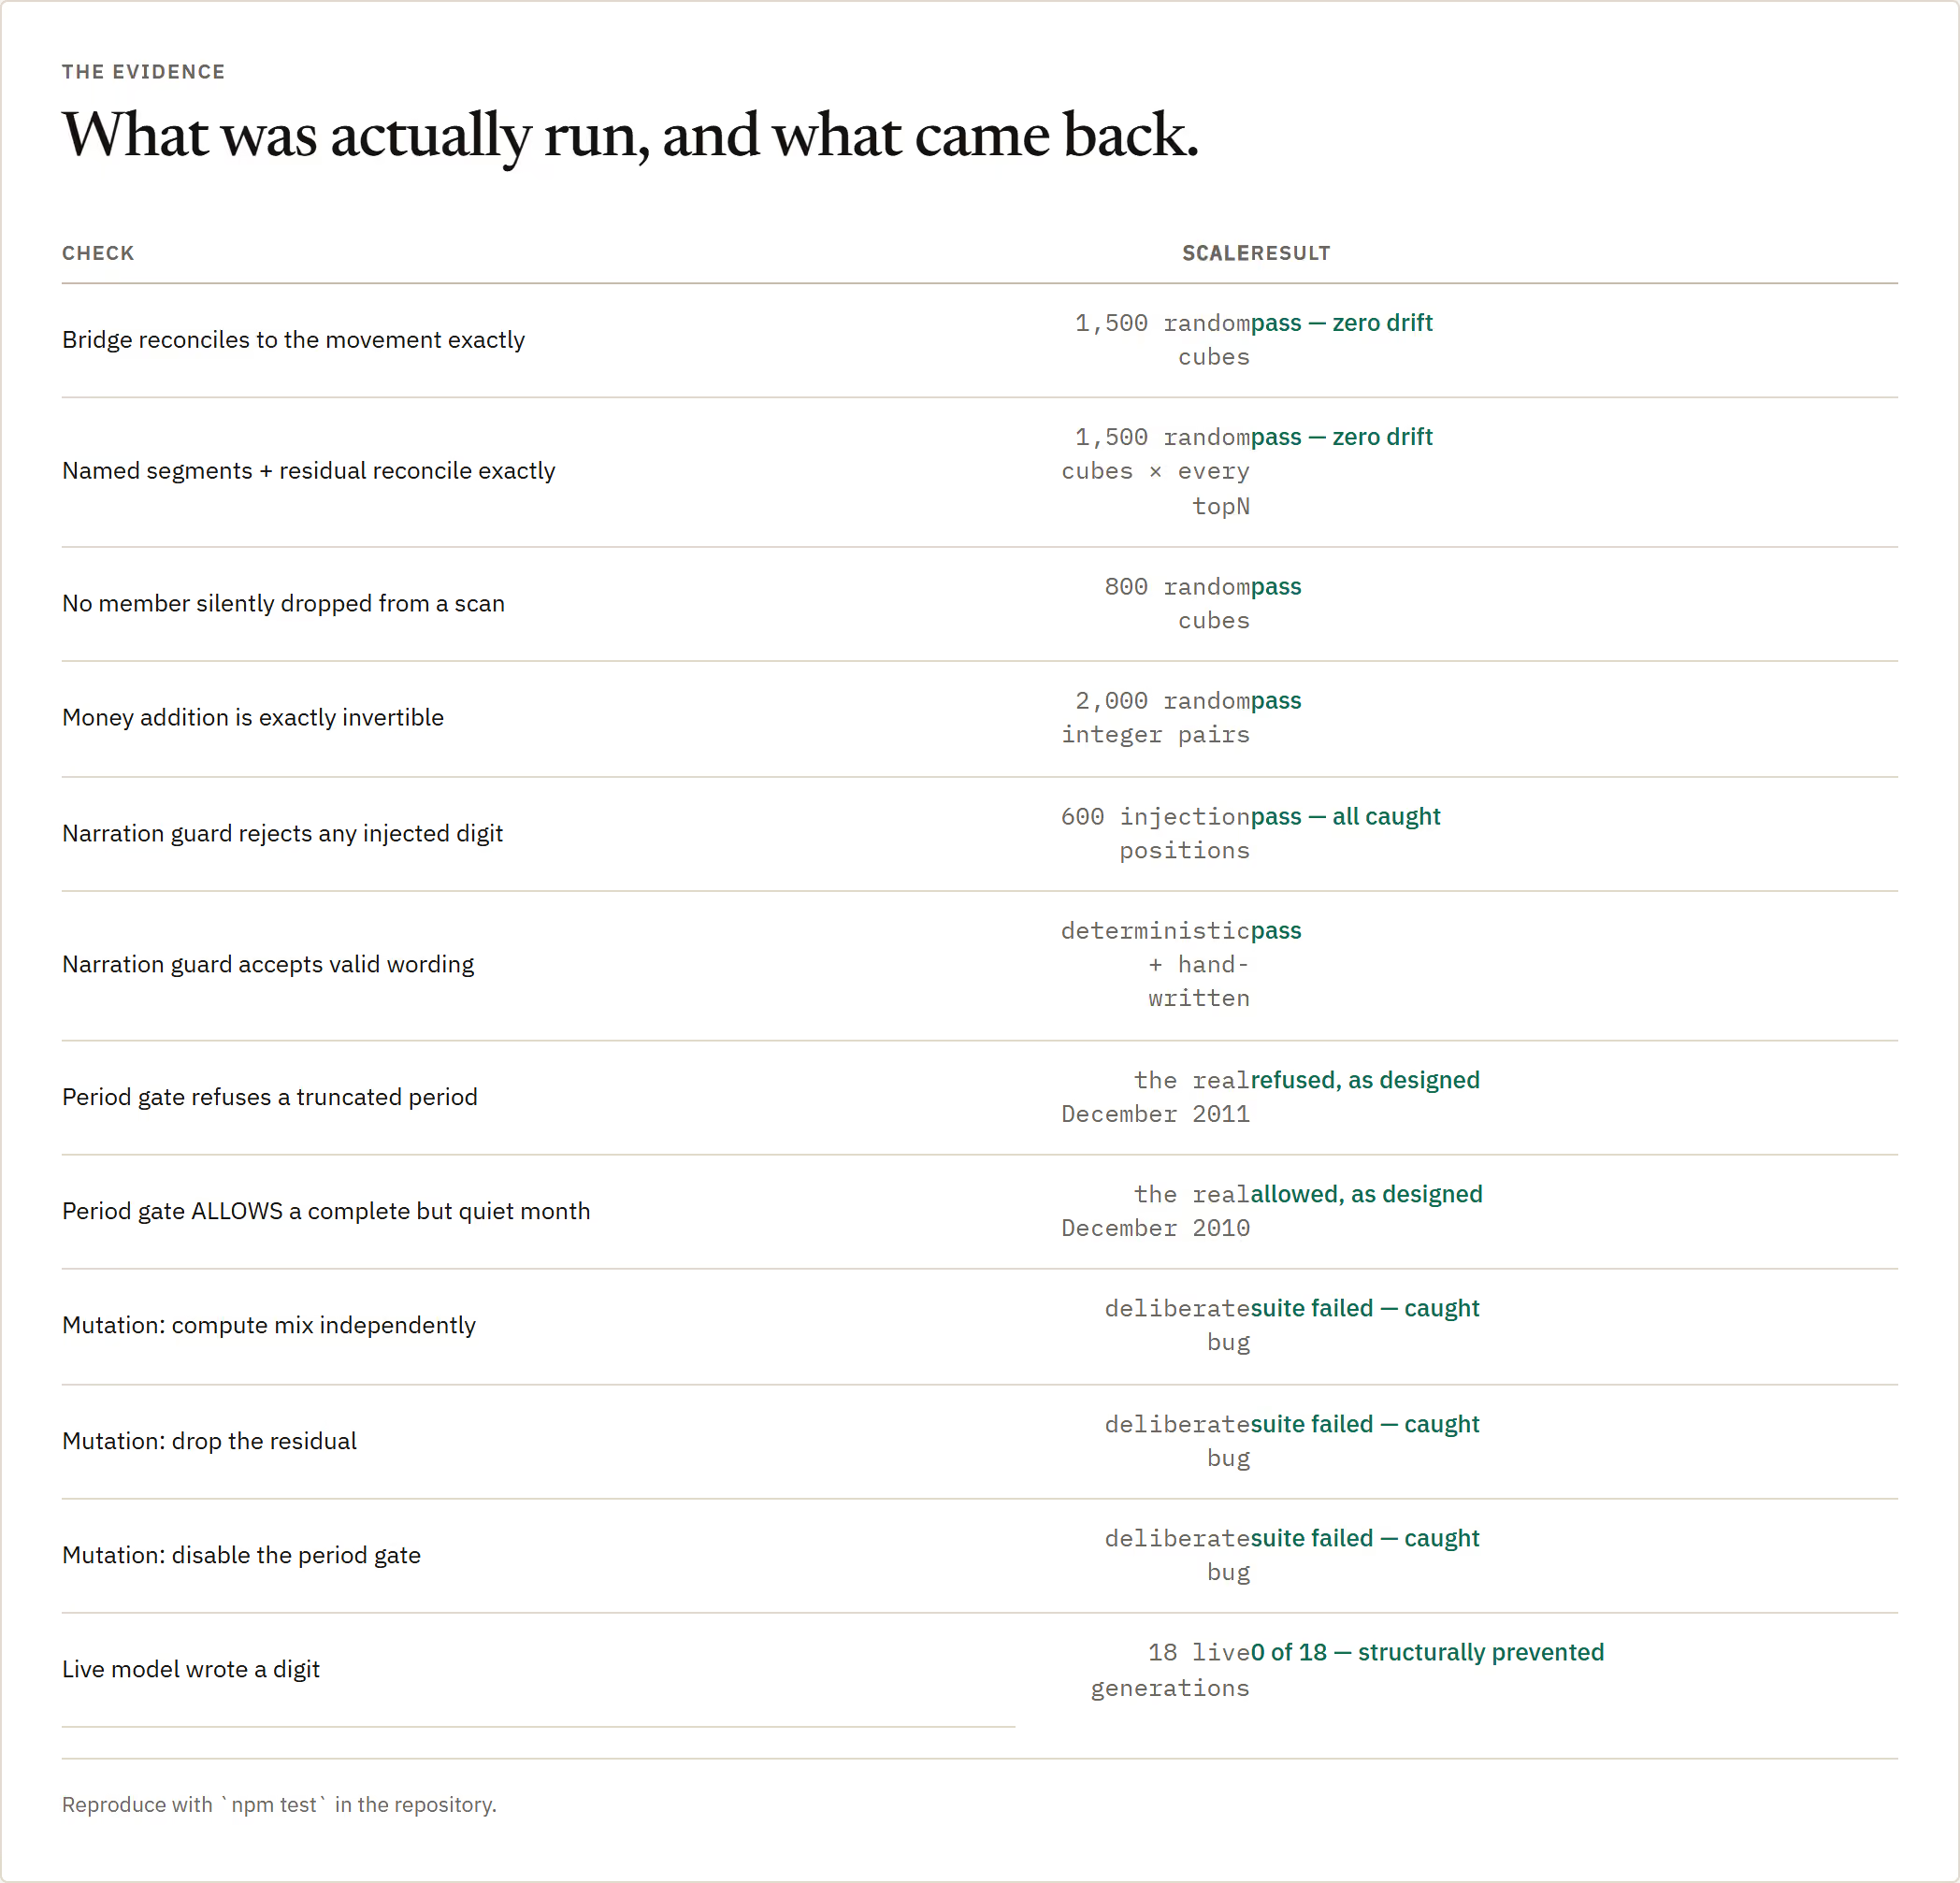
Before it explains anything, a gate checks whether the periods you are comparing are even comparable. In the sample ledger, one period out of twenty-five fails that check — December 2011, which holds nine calendar days and eight trading days against a typical month of twenty-six. The refusal is issued before any explanation is attempted.
1 receipt
- see it refuseAct Two is the refusal, with the day counts and the reason, and a better comparison suggested in its place.
Then it hands you the question you should have asked instead: the same month, one year apart, both of them complete.
Then it proposes the comparison you should have asked for. November 2010 against November 2011 — same month, one year apart, so seasonality is held constant, and both fully observed. The real answer turns out to be plus 2.7%, not minus 57.6%.
1 receipt
- see the real findingAct Three: the honest comparison, and why that specific pair.
Even “roughly flat” turns out to be a disguise. Flat here means two much larger forces pulling against each other and very nearly cancelling.
And "plus 2.7%" is not the finding either — it is the disguise. Underneath it, £484k of brand-new products is being swallowed by £245k of lost volume, £138k of mix and £135k of discontinued lines, with £73k of price the only other thing pushing back. Five named pieces, and they reconcile back to the totals exactly.
1 receipt
- see the decompositionA waterfall from £1.46m to £1.50m through five named effects that sum exactly.
The “is your data any good” check runs FIRST, not in a footnote at the bottom. If your file is wrong this tool will explain a wrong number beautifully, and you need to know that before you read the answer, not after.
It runs a data-quality exhibit first, before any finding, rather than as a footnote afterwards — because if the source file is wrong this will faithfully explain a wrong number, and that needs saying before you read the answer, not after.
1 receipt
- see it liveData quality is stated before any finding, on purpose.
A million rows, and not one of them leaves your laptop. No server, no upload, no account — which is the only reason anybody would ever point it at a real ledger.
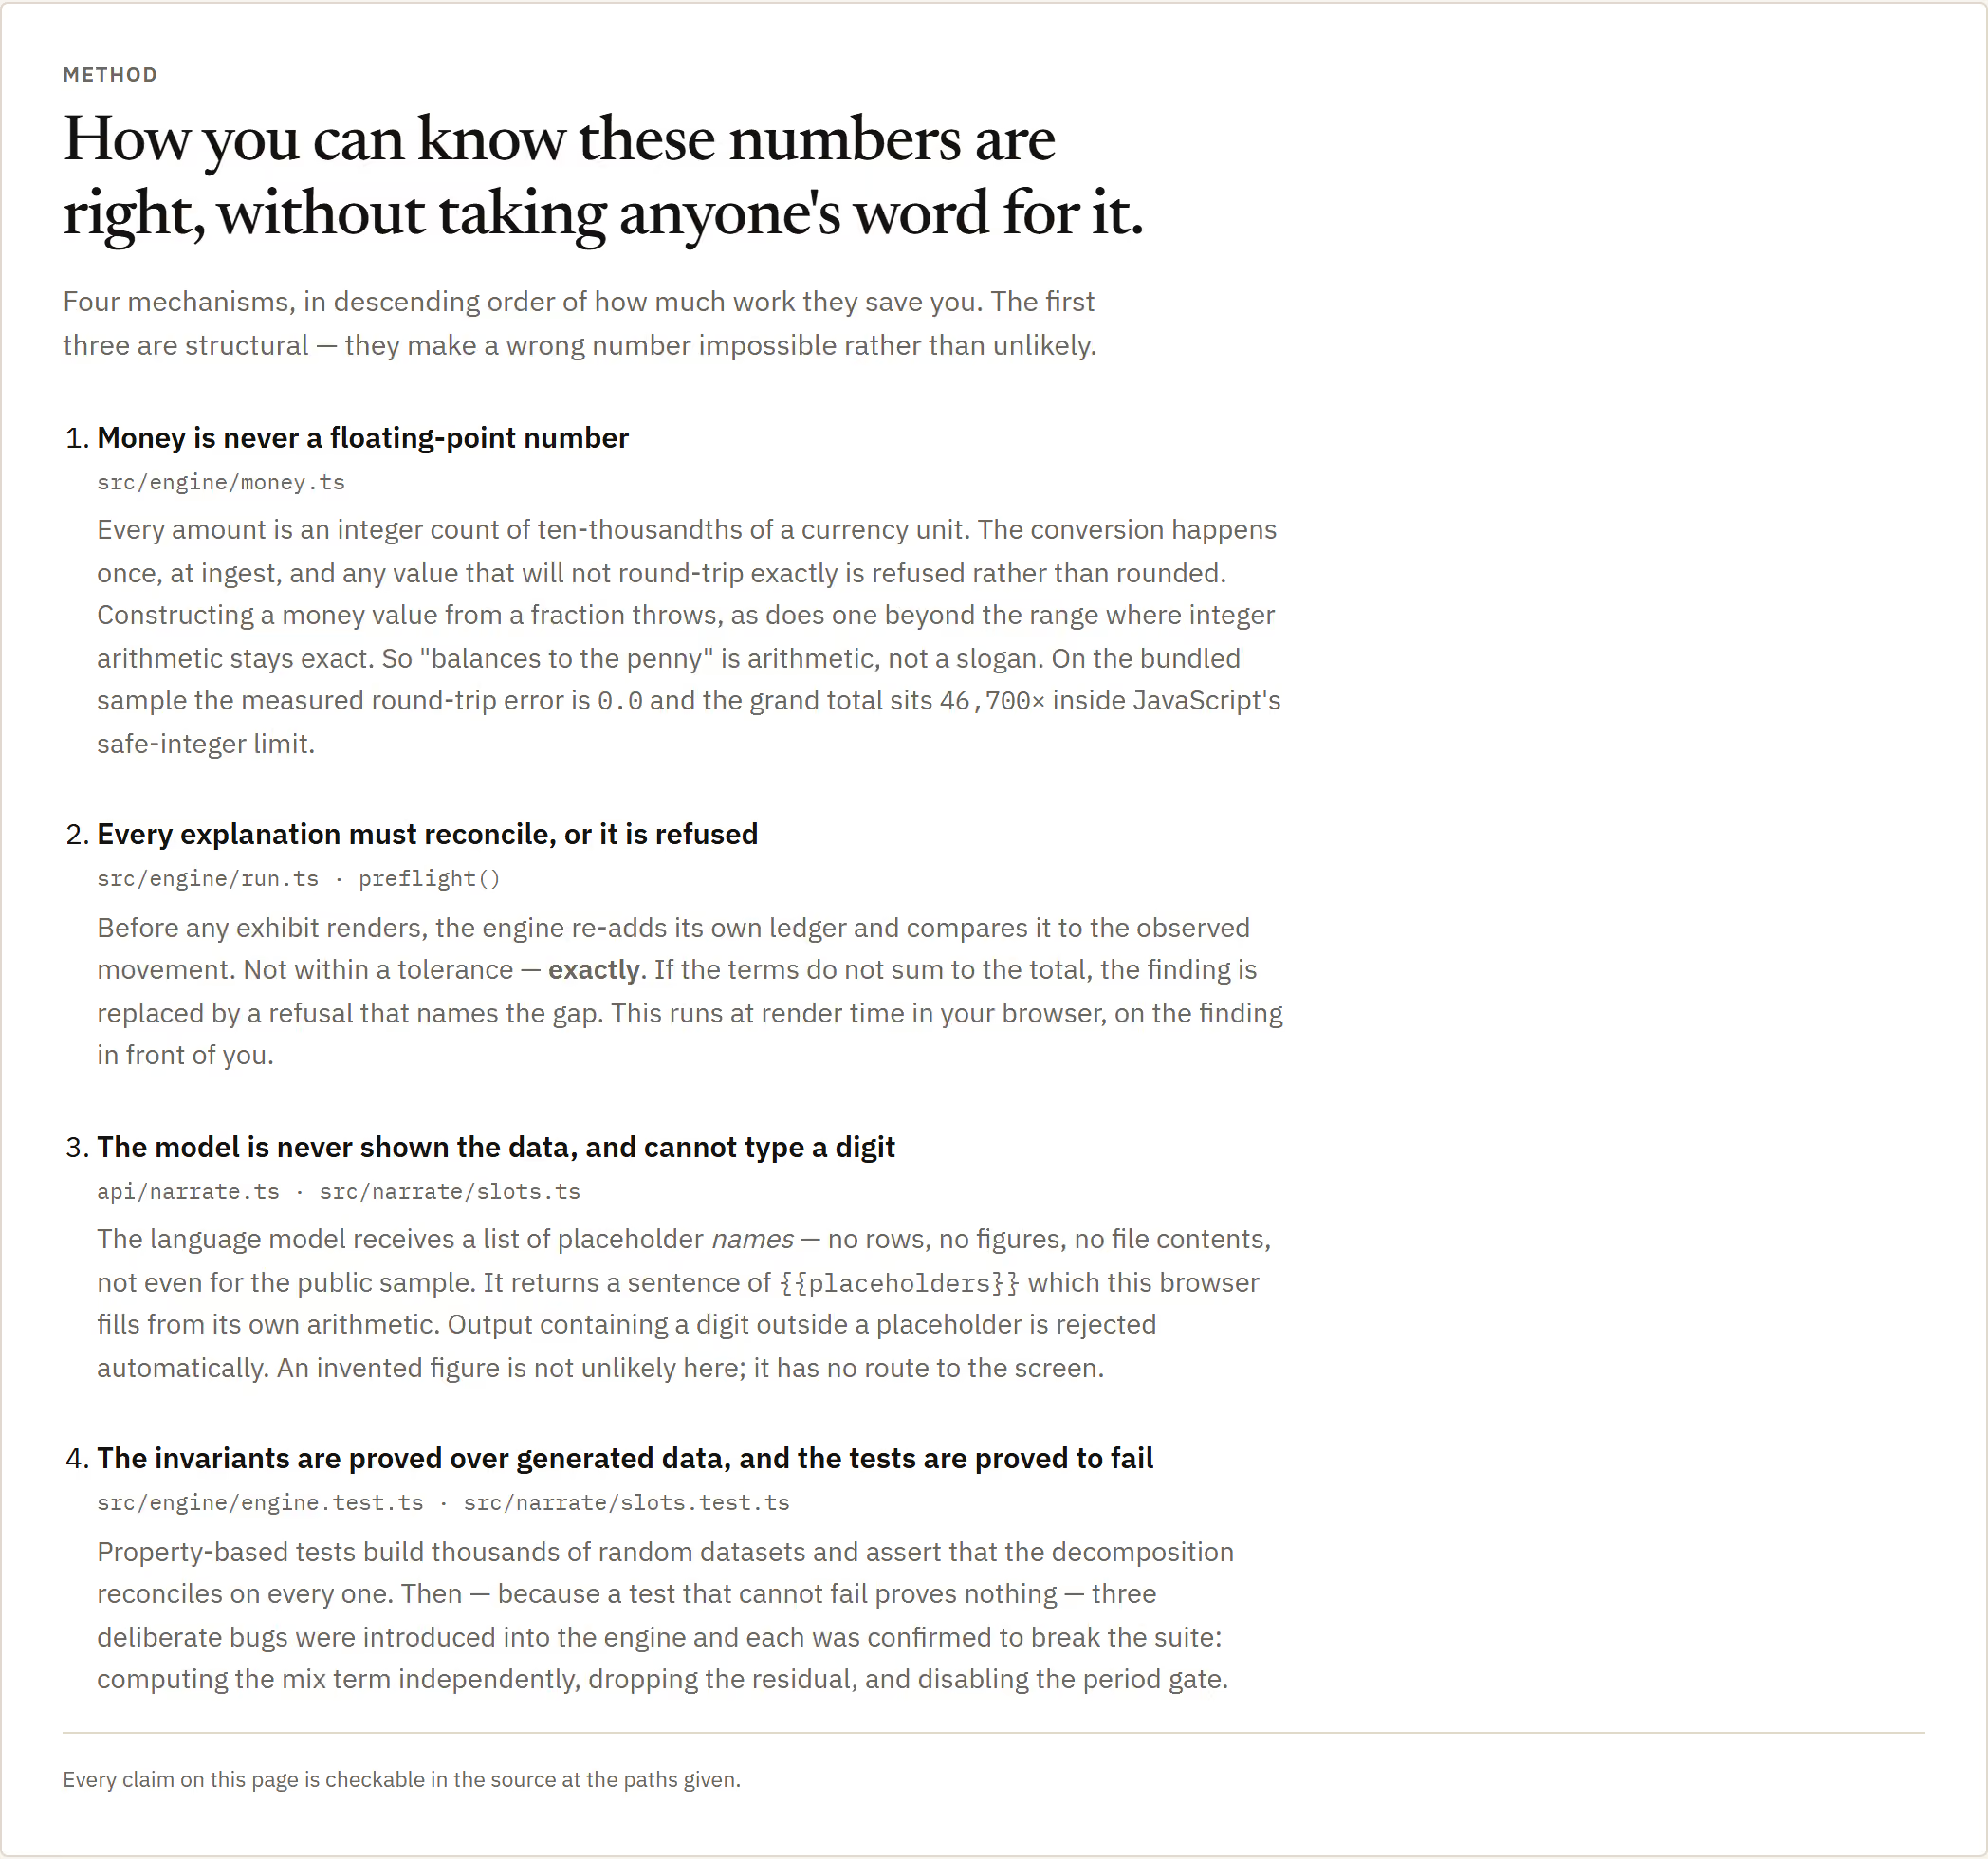
A million rows and nothing leaves your machine. The whole analysis runs in the browser — no server on the data path, no account, no upload. For anyone who would like to point an analytics tool at a real ledger without emailing it to a vendor, that is the entire ballgame.
1 receipt
- see it live"Data sent to a server: None. Ever." — stated in the header and true of the architecture.
The numbers
receipts
- see it liveRow count printed in the header alongside the period covered.
receipts
- see it liveAct One computes the first, Act Two refuses it, Act Three earns the second.
receipts
- see it liveThe gate runs across every period, not just the one you asked about.
receipts
- see it liveVolume, price, mix and interaction, new products, discontinued.
The part most people would have skipped
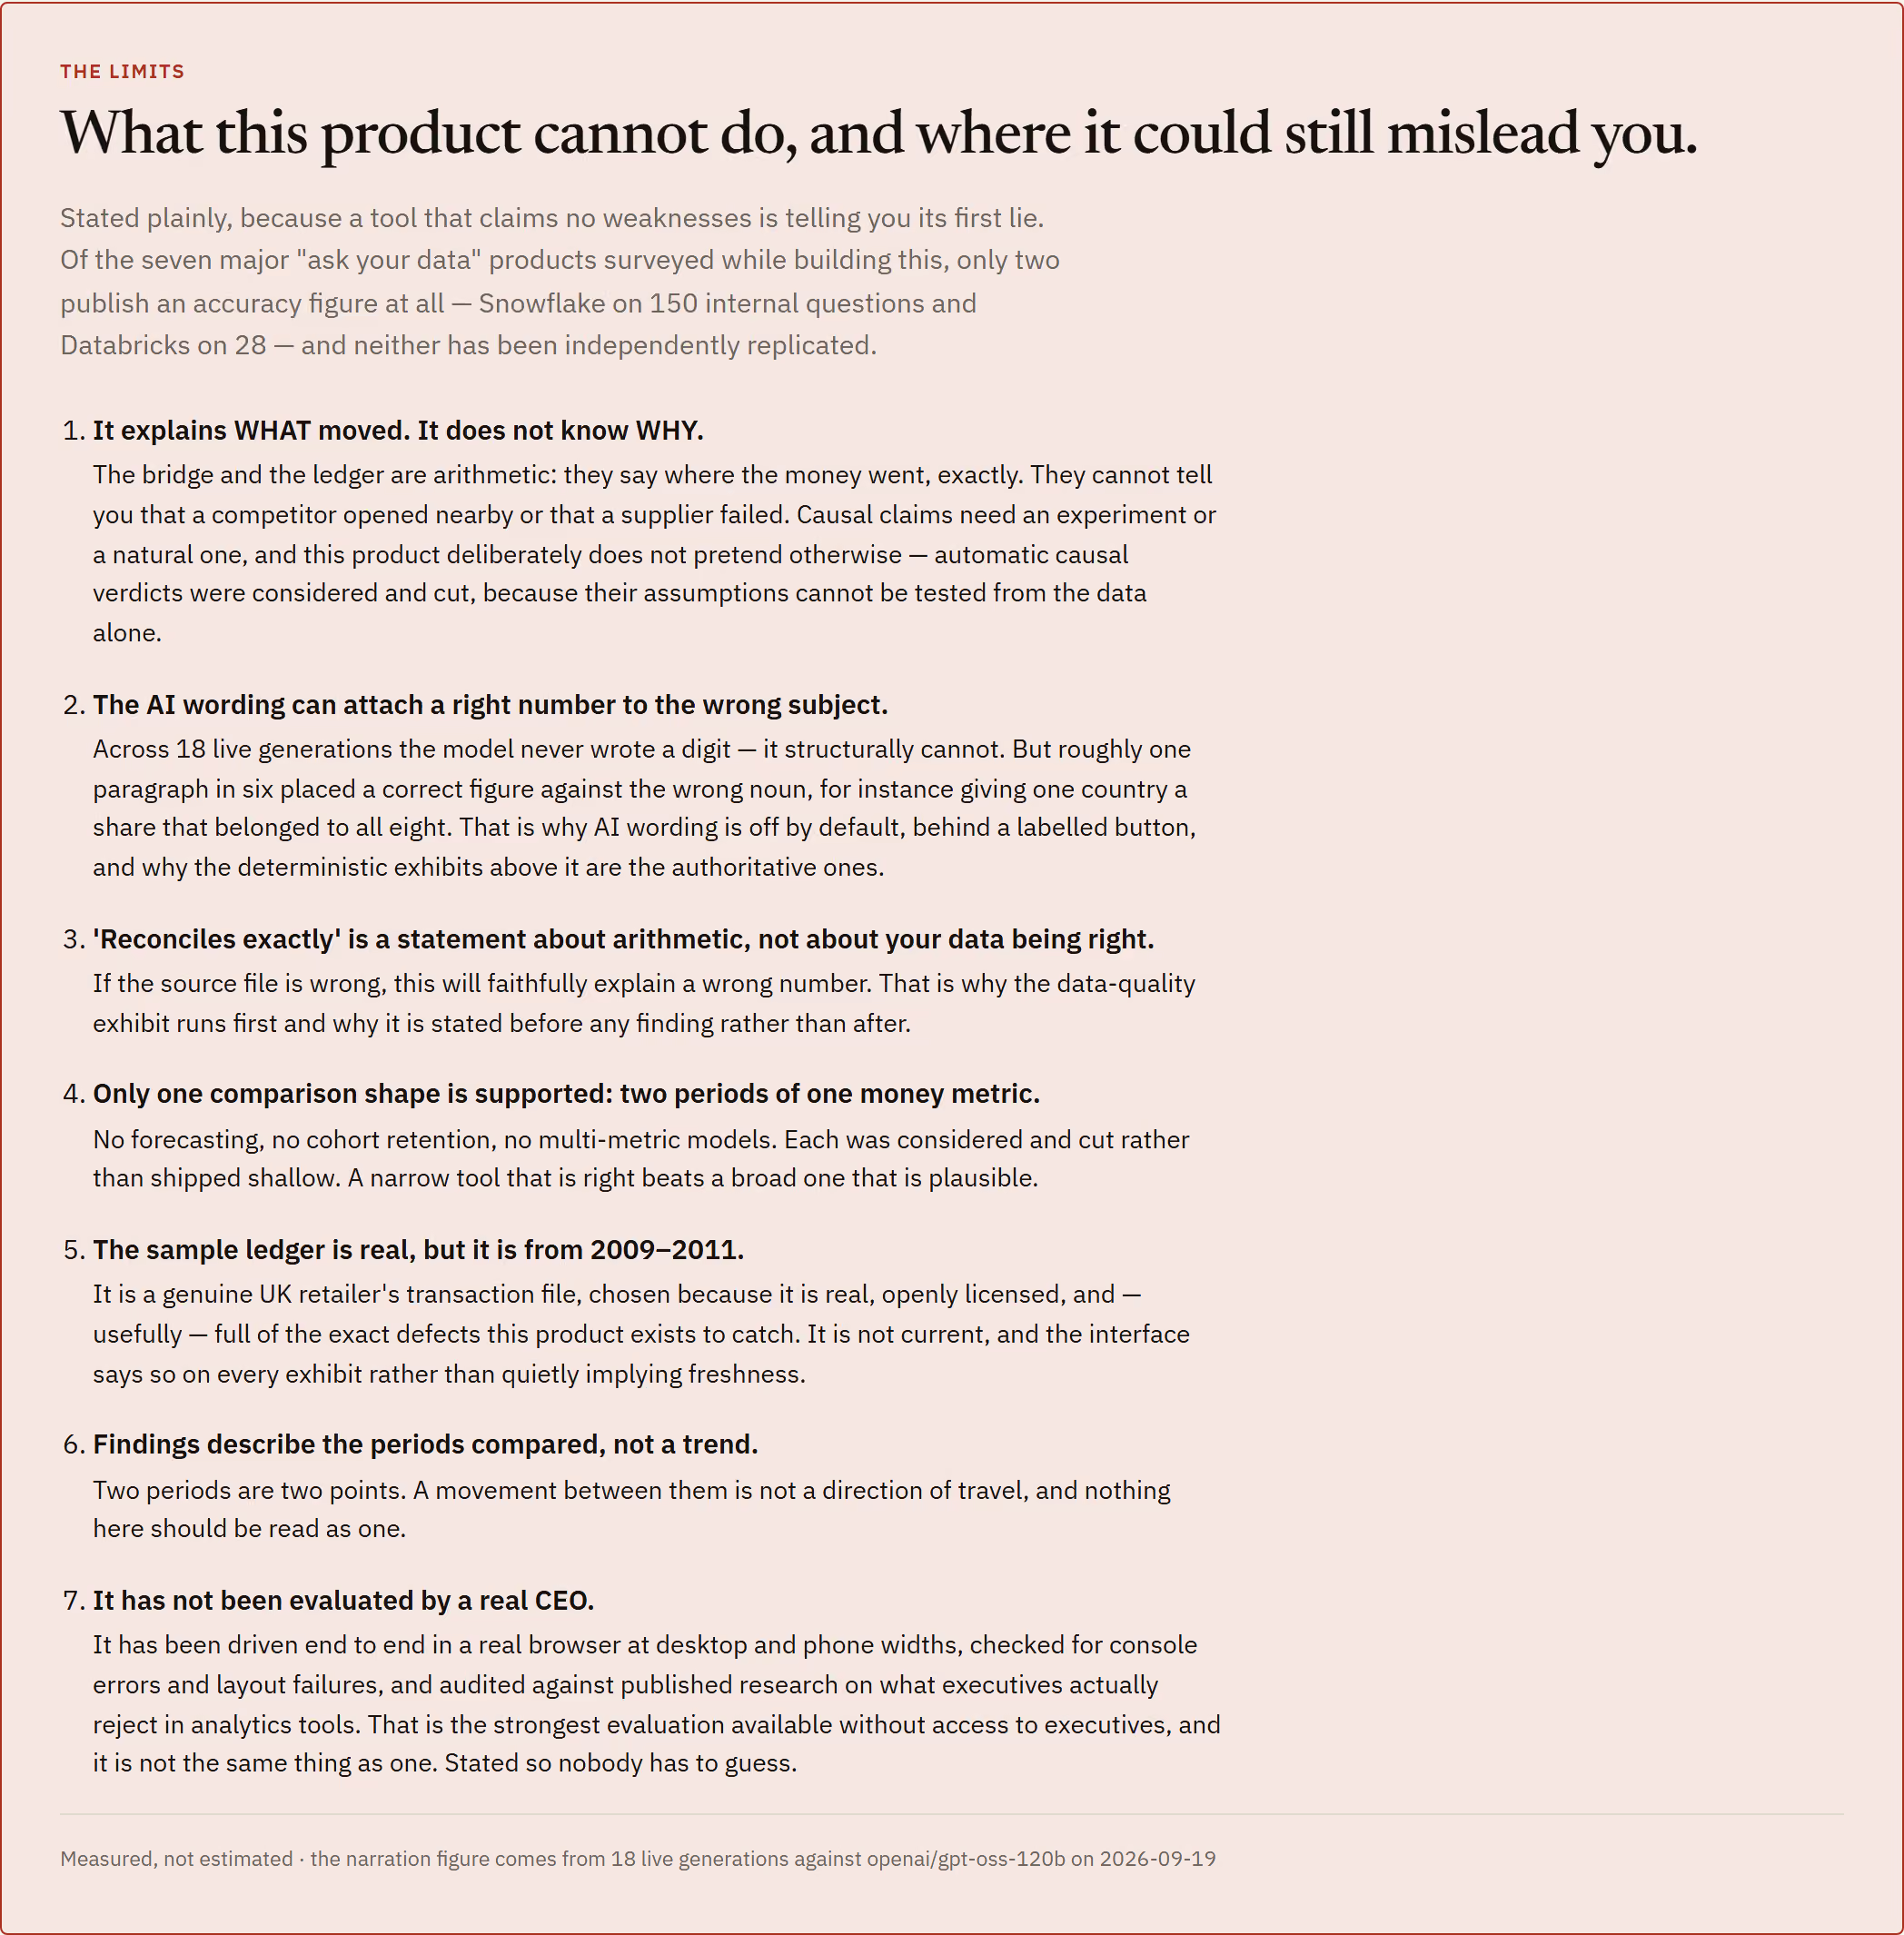
It only supports one shape of question: two periods, one money metric. I considered forecasting, cohort retention and multi-metric models, and cut all three rather than ship them shallow — a narrow tool that is right beats a broad one that is plausible. And the limits are written on the page itself, including the ones that cost me: the sample ledger is real but it is from 2009 to 2011 and the interface says so on every exhibit rather than quietly implying freshness; two periods are two points, so a movement between them is not a trend and nothing here should be read as one; and no actual CEO has evaluated it, which I say plainly rather than letting anyone assume otherwise.
What it can't do
- One question shape only: two periods, one money metric. Forecasting, cohorts and multi-metric models were considered and cut rather than shipped shallow.
- The sample ledger is genuine but historical — 2009 to 2011 — and the interface says so on every exhibit.
- Two periods are two points. A movement between them is not a trend.
- If the source file is wrong, it will faithfully explain a wrong number. That is why the data-quality exhibit runs first.
- No real executive has evaluated it. It has been driven end to end in a browser at desktop and phone widths and audited against published research on what executives reject — which is the strongest evaluation available without access to one, and not the same thing.
- TypeScript
- in-browser analysis
- no backend
- print/PDF export
- UCI Online Retail II (CC BY 4.0)